Time in status
Why JQL Time-in-Status Queries Don't Give You Real Time Data
If you’ve ever tried to answer “how long do our issues actually sit in each status?” with JQL, you’ve hit the wall this article is about. You can get impressively close, and then discover that JQL simply doesn’t do the one thing you need.
The reason is fundamental, not a syntax you haven’t found yet: JQL filters issues, it doesn’t measure them. It can locate issues based on when a status change happened, but it has no native concept of duration. Understanding exactly where that line falls, and how to cross it, is the difference between guessing at your workflow and actually seeing it.
What JQL does brilliantly
JQL is excellent at finding issues by the timing of their status changes. The CHANGED operator, with AFTER, BEFORE, DURING, FROM, and TO, gets you a long way:
-- Work that has stalled: still In Progress, untouched for 10 days
status = "In Progress" AND NOT status CHANGED AFTER -10d

-- Everything that reached Done in the last two weeks
status CHANGED TO "Done" AFTER -14d

-- Issues that moved from In Review back to In Progress (rework)
status CHANGED FROM "In Review" TO "In Progress"
These are genuinely useful. If your question is “which issues match this condition?”, JQL answers it cleanly.
Where JQL hits a wall
The moment your question turns from which issues to how long, JQL has nothing to offer. There is no function, field, or operator in native JQL that returns:
- Cycle time: how long an issue was actively worked, start to finish.
- Lead time: the end-to-end duration from created to resolved.
- Time in status: how many hours an issue has spent in “In Progress,” or “Waiting for Approval.”
- Average duration in a status across a project or sprint.
- Transition time between two stages, like Dev → QA.
status CHANGED AFTER -10d tells you an issue hasn’t moved recently. It does not tell you it’s been in that status for 11 days, or 40, or 400. To get the actual number, someone has to open the issue, read the history, find the timestamps, subtract them, and (if they want an honest figure) strip out the weekend and the two public holidays in between. Repeat for every issue. By hand. Every week.
That’s not reporting. That’s data entry with extra steps, and nobody trusts the spreadsheet by the time it’s finished.
The questions your team actually asks
None of these can be expressed in native JQL, yet they’re the ones that matter:
- How long is work actually in development, versus just sitting open?
- What’s our average time between the Dev and QA hand-off?
- Where is the bottleneck: review, testing, or the queue before either?
- Which tickets have blown past our SLA for time “with the team”?
- How much time do issues spend blocked, separate from active work?
Duration metrics reveal process health: not whether work exists, but how efficiently it flows. JQL was built for discovery, not measurement, so this is exactly the gap it leaves open.
Closing the gap: measure from status history
The fix isn’t a cleverer query. It’s a layer that reads the status-change events Jira already records, calculates the durations for you, and stores them where both JQL and your reports can reach them. That’s what ChronoFlow - Time in Status and Wait Time Analysis for Jira does, an app for Jira Cloud. Here’s what changes.
Time-in-status custom fields
ChronoFlow adds custom fields that compute duration from an issue’s history and keep updating as it moves. You can configure three flavours:
- Time in Current Status: how long the issue has been in whatever status it’s in right now. A 🕒 clock icon means the timer is still running.
- Time in a Selected Status: total time spent in one specific status (say, In Progress), even after the issue has moved on. A ⏸️ pause icon means that timer has stopped.
- Time in Previous Status: how long it spent in the status it just left.
Because these are real Jira custom fields, you can put them on the issue view, on board cards, and in the issue navigator, no opening the history and doing mental arithmetic.
Status groups: measure phases, not 15 statuses
Real workflows sprawl. A team might have Backlog → Grooming → Ready for Dev → In Progress → Code Review → QA → UAT → Ready for Release → Released, and leadership only cares about four phases. Status Groups let you fold many statuses into one business-meaningful bucket:
| Status group | Contains |
|---|---|
| Planning | Backlog, Grooming, Ready for Dev |
| Development | In Progress, Code Review |
| Validation | QA Testing, UAT |
| Done | Ready for Release, Released |
A “Time in Status” field pointed at a group tracks the total time across every status in it. Groups also normalise inconsistent naming across team-managed projects: “Developing,” “In Progress,” and “Working” can all roll up into one Active Work metric so cross-team numbers are finally comparable. They’re just as good at isolating Blocked time (On Hold + Waiting for Info + Impediment) or, for support, splitting With Team from With Customer for SLA purposes.
Business-hours calendars: the fix for the Friday-evening problem
This is the one most homegrown solutions get wrong. An issue raised Friday at 6pm and resolved Monday at 9am looks like a 60-hour ordeal on a raw clock, when the team spent barely any working time on it. ChronoFlow’s calendars let you define working days, working hours (including split shifts), timezone, and holidays (or import them from an ICS file), so every metric reflects business hours only. Multinational teams can assign different calendars per project or region, so a team with more public holidays isn’t unfairly penalised in the numbers.
Now JQL can measure duration
Here’s the payoff. Once the durations live in custom fields, they become JQL-searchable. Each ChronoFlow field exposes two properties:
.timeInMinutes: the accumulated time, in minutes (business hours only)..running: a boolean for whether the timer is still counting.
Which means the queries JQL could never express before now just work:
-- Issues that have spent more than 8 hours in a tracked status
"Time in Status.timeInMinutes" >= 480

-- Everything still accumulating time (stuck, or waiting on an empty date)
"Time in Status.running" = "true"

-- SLA watch: Support tickets sitting 8h+ in Waiting for Approval
project = "SUPPORT" AND "Time in Status.timeInMinutes" >= 480 AND status = "Waiting for Approval"

-- Rank by how long, longest first
"Time in Status.timeInMinutes" < 60 ORDER BY "Time in Status.timeInMinutes" DESC
This is the capability the community keeps asking JQL for. It was never going to come from native JQL; it comes from feeding real duration data back into JQL.
From queries to reports and charts
Filtering is only the start. ChronoFlow’s Reports let you scope a set of issues with a JQL query, then see time-in-status, transition times, and per-assignee breakdowns in a grid, with Lead Time, Cycle Time, and Response Time calculated for you. Filter a generated report by This Week, Last Month, a specific Sprint, or a custom range; export up to 1,000 issues to Excel-ready CSV; and share saved reports with users or groups.
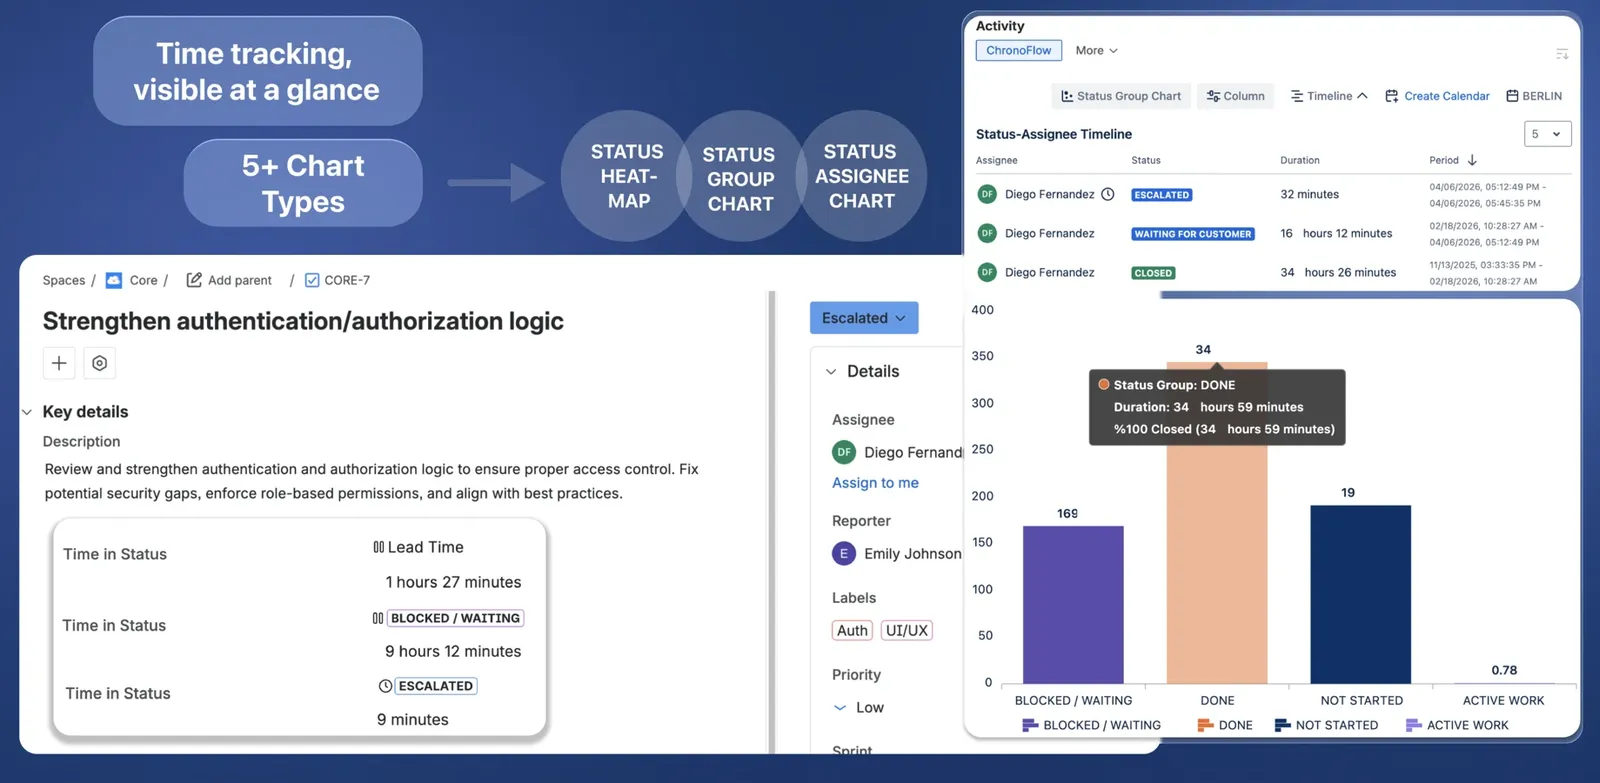
For a single issue, the Issue Activity panel visualises how its time was distributed across statuses and assignees, with a timeline table and six chart types (by status, by assignee, by status group). And because the fields sit on board cards, a Kanban board becomes a live bottleneck detector: if Review time is consistently high across cards, you can see it at a glance rather than mining it out of history.
The bottom line
Native JQL is a discovery tool. It will happily tell you which issues changed status and when, and it will never tell you how long they stayed there, because duration isn’t a concept it has. No query fixes that; only calculating durations from status history does.
ChronoFlow closes the gap on both ends: it turns status-change events into accurate, business-hours time-in-status data, puts that data on issues, boards, and reports, and, crucially, hands it back to JQL so the queries you always wanted to write finally return real numbers.
See it on your own workflow. ChronoFlow is on the Atlassian Marketplace with a free trial. Add a Time-in-Status field, point it at a status that always seems slow, and watch the real number appear.
Full configuration details are in the ChronoFlow documentation. Still deciding what kind of time tracking you need? See how to choose a Jira time-tracking app: logged time and time-in-status need different tools.