Cost tracking
Jira Cost Management: Turn Worklogs into Cost, Revenue, and Profit
Jira can tell you that your team spent 240 hours on a project last month. It can’t tell you whether that project made money.
That’s the gap at the heart of cost management in Jira: Jira tracks effort, not money. Worklogs carry hours, not value. Nobody’s hourly cost is recorded. And so the moment a finance lead, an account manager, or a founder asks “what did this actually cost, and did we profit?”, the work moves into a spreadsheet, where it’s instantly stale and impossible to trust.
You don’t need a separate finance system to close that gap. This guide shows how to put a real number on every logged hour (cost, billable revenue, and profit) using WorklogPRO and its rate tables, right inside Jira.
The problem: hours without a price tag
A worklog says “2h on SCRUM-6.” Useful for delivery, useless for finance, because it’s missing two numbers:
- What that hour cost you: the loaded internal cost of the person who logged it.
- What that hour is worth: the rate you bill a client for it.
Without those, you can’t answer the questions that actually run a business: Is this client profitable? Is this fixed-price project underwater? Which feature cost the most to build? WorklogPRO’s answer is to attach rates to the time you’re already logging, and let every report do the arithmetic.
Step 1: Define your rates once with Rate Tables
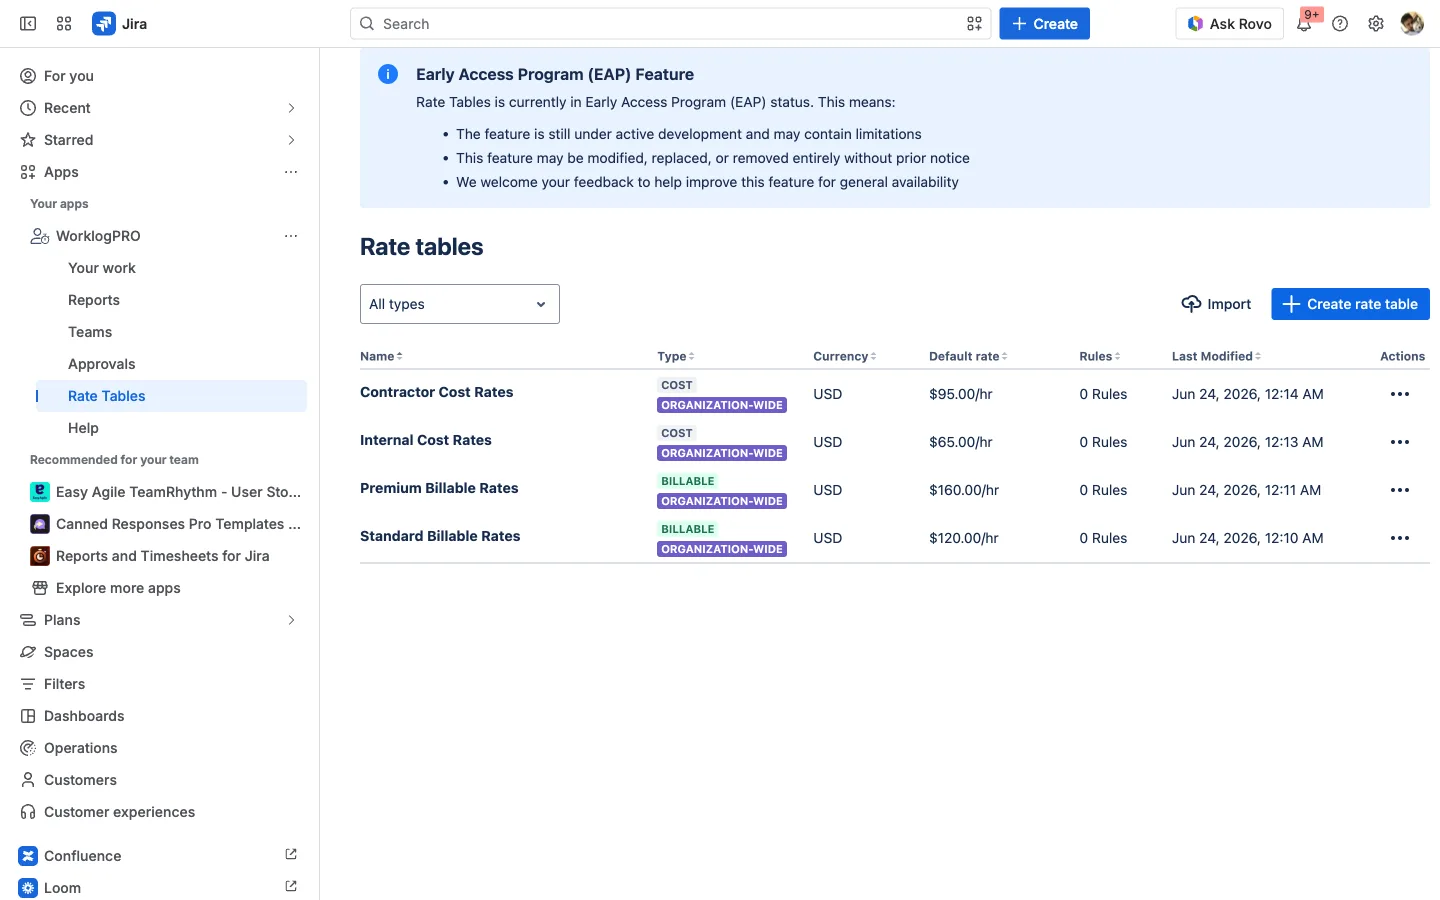
A Rate Table is a named, per-hour price list. WorklogPRO has two kinds, and you’ll usually want one of each:
- Billable Rate Table, the revenue for each hour worked: what you charge a client.
- Cost Rate Table, the internal cost of each hour: what that time costs you in salary, overhead, or contractor fees.
Each table is just a currency and a default rate per hour. Create a couple (say Standard Billable Rates at $120/hr and Internal Cost Rates at $65/hr), and you’ve already given every future worklog both a price and a cost.
Different people, different rates: without the spreadsheet
A senior engineer, a junior developer, a contractor, and a support specialist don’t cost the same, and you don’t bill them the same. Rate tables handle this with Rules layered on top of the default rate.
Each rule is a conditional override, and its conditions can match on who, where, and what kind of work:
- User: a specific person’s rate (your senior engineer bills higher than a junior).
- Project: a premium rate for one client, a discounted internal rate for another.
- A custom worklog attribute: your own per-worklog field. If you’ve defined a Work type attribute, a rule can make Codding cost more than Testing, for example.
WorklogPRO evaluates rules from highest to lowest priority and applies the first rule whose conditions all match; if none match, the default rate is used. So you set a sensible default, add a few rules for the exceptions, and the right rate is picked automatically every time: no manual tagging after the fact.
About those attributes: Work type, Billable, and the like aren’t built in: they’re custom worklog attributes you create with WorklogPRO’s attributes feature (a dropdown, a checkbox, a text field). Define the ones your business cares about, and they become available both for rate-table rules and for grouping in reports. (Full guide to custom worklog attributes.)
The result: one rate table models your whole labor economics, and it keeps working as people log time day to day.
Step 2: See cost, revenue, and profit in your reports
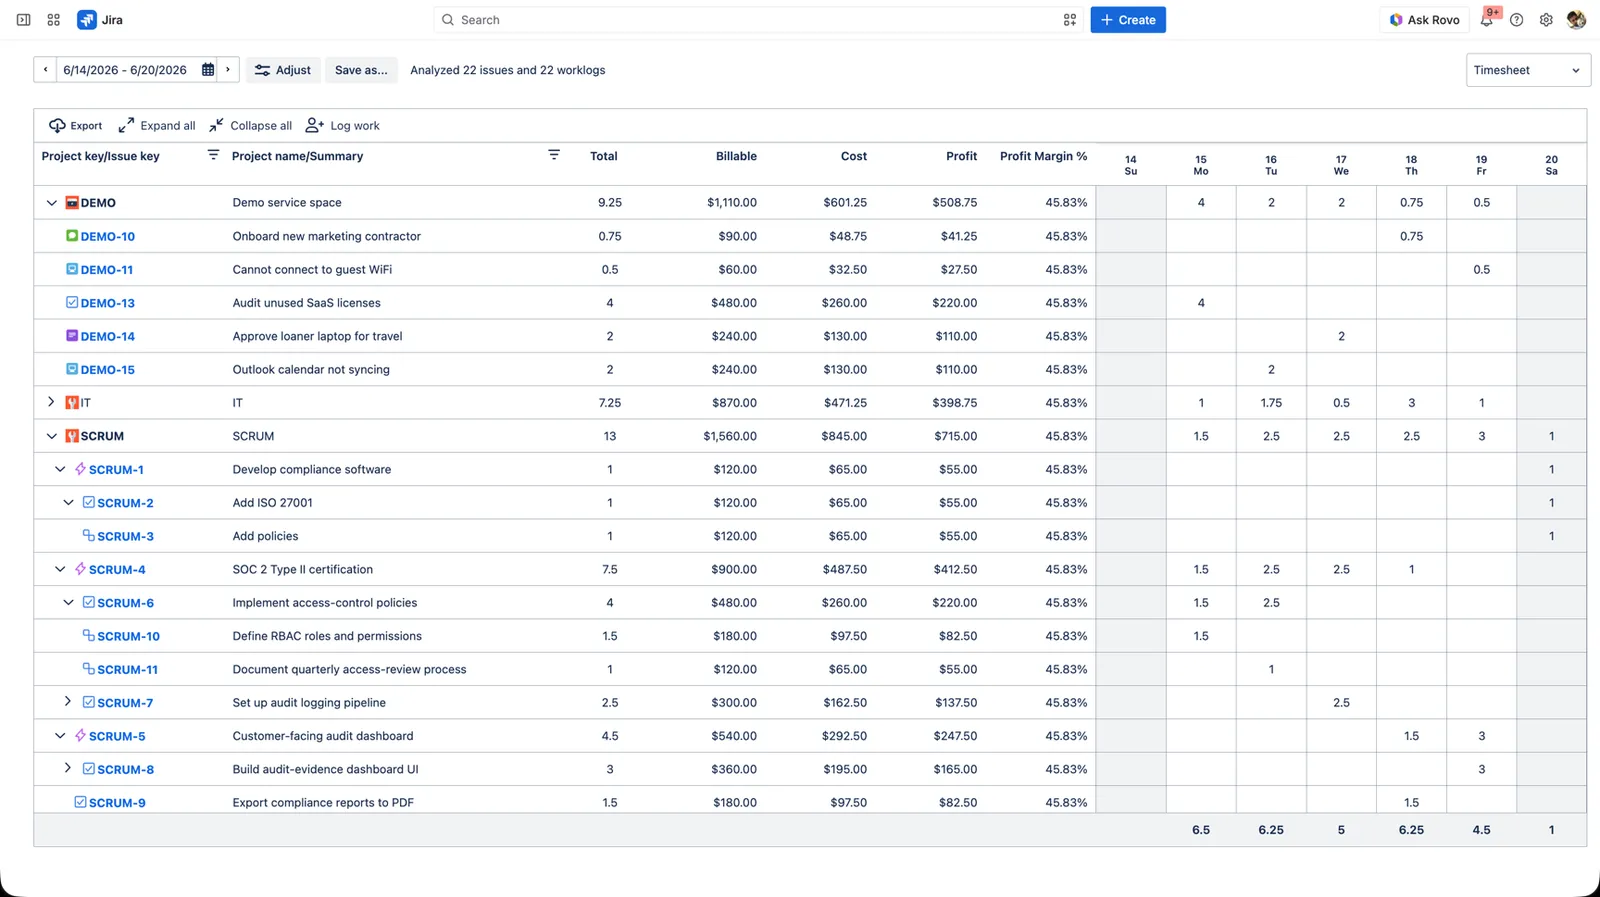
Rates only matter when they show up in a report. Open any WorklogPRO report’s Billable/Cost tab and point Calculate Billable Using at a billable table and Calculate Cost Using at a cost table. The report instantly grows four money columns alongside the hours:
- Billable: hours × billable rate
- Cost: hours × cost rate
- Profit: Billable − Cost
- Profit Margin %: Profit ÷ Billable
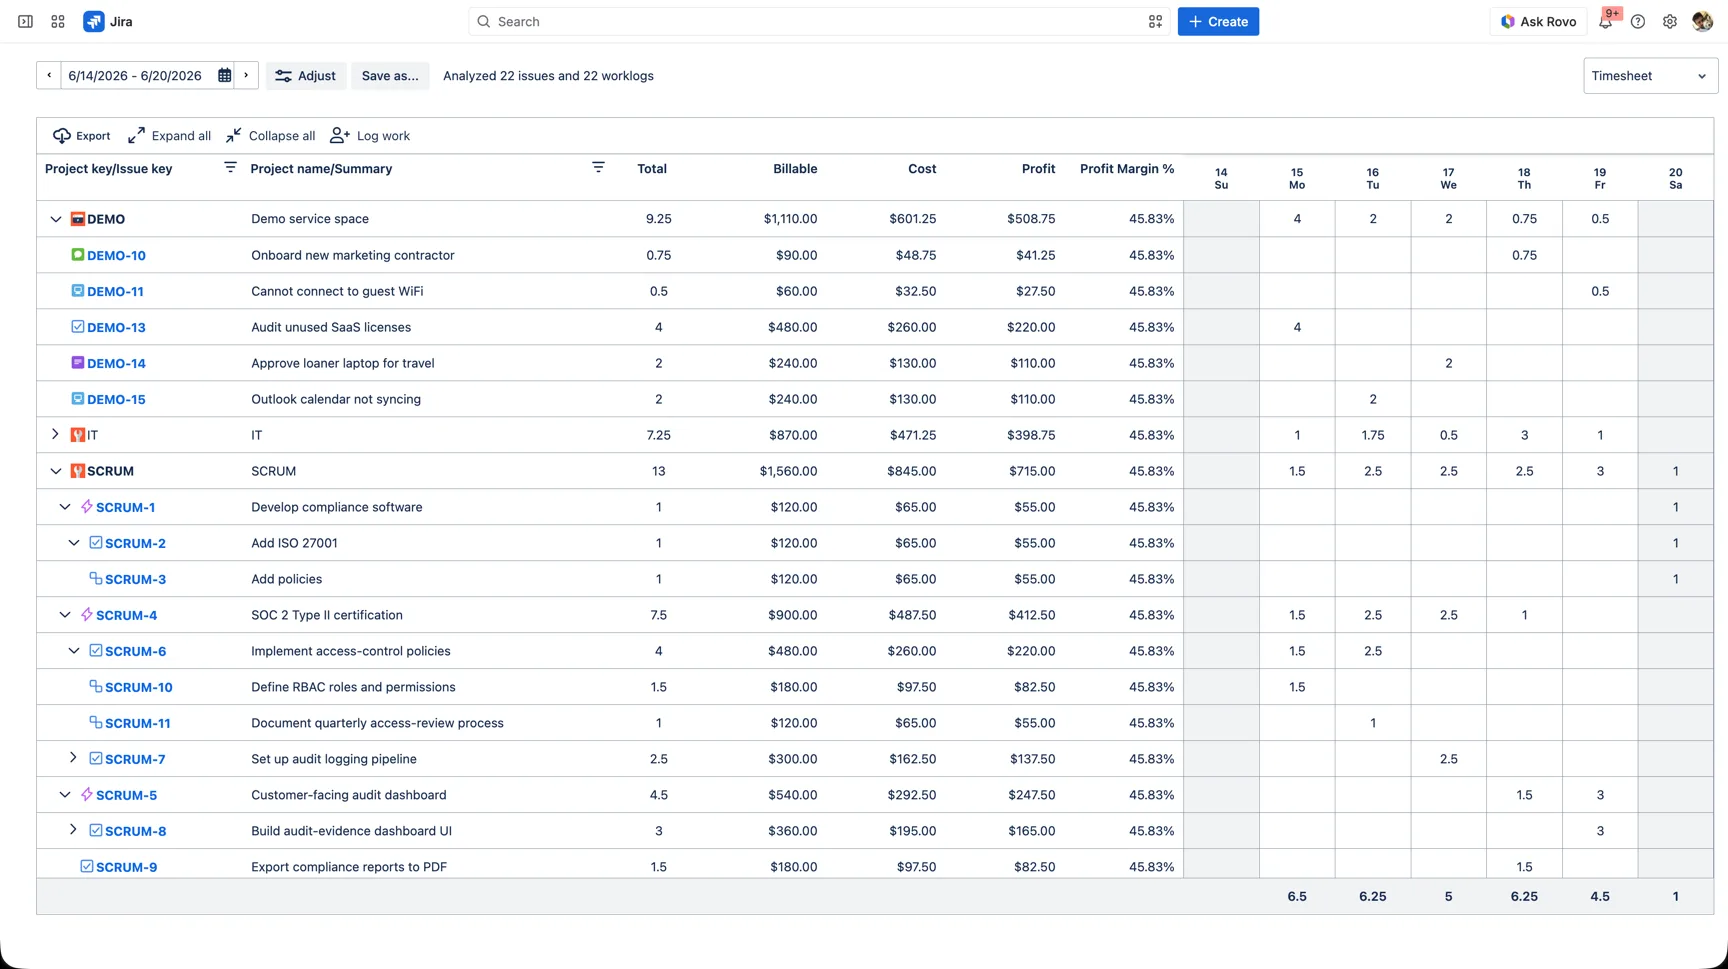
Profit and margin are calculated automatically whenever your billable and cost tables share the same currency. Group the report by project, by epic, by person, or by client and you can read profitability at exactly the level you care about: “this client ran a 46% margin, that fixed-price job barely broke even.”
Step 3: Chart where the money goes
Numbers in a grid are precise; a chart is persuasive. Switch the report’s view to Chart and WorklogPRO plots Billable, Cost, and Profit as bars with Time spent as a line, grouped however you like.
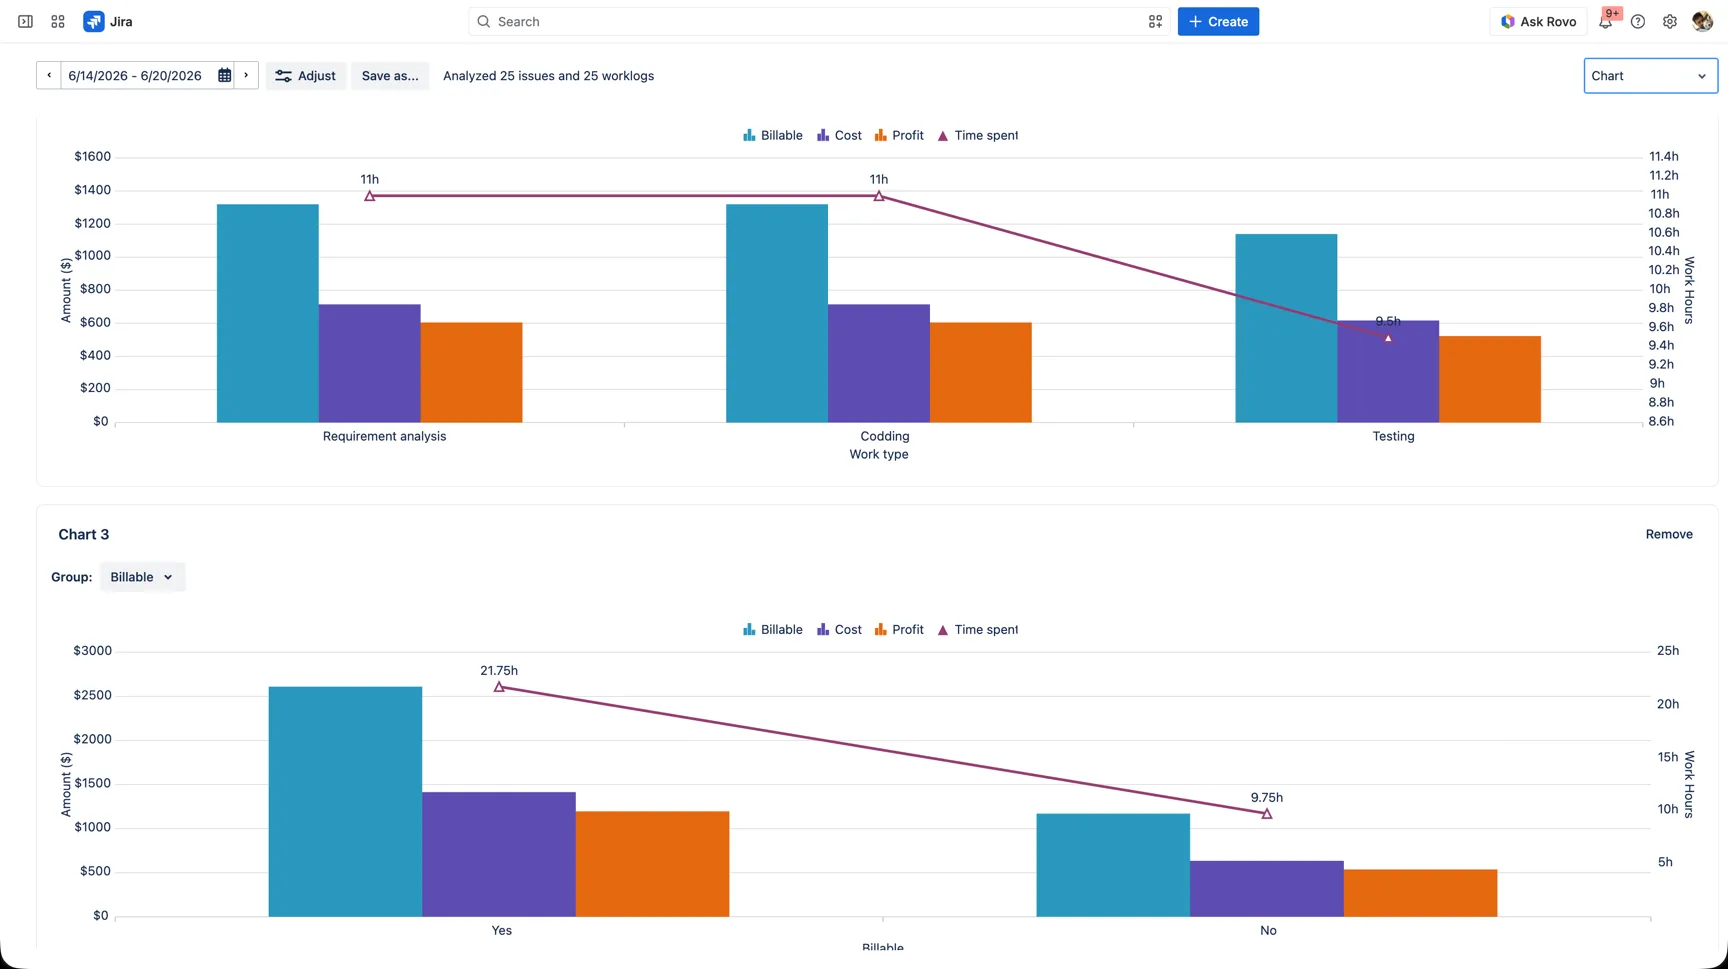
Group by your Work type attribute to see which activities consume the budget, or by your Billable flag to compare revenue-generating work against everything else. It’s the fastest way to spot where effort and money diverge.
A note on currencies
If your teams bill in different currencies, give each rate table its own currency. Just remember the rule for automatic profit: Profit and Profit Margin only compute when the billable and cost tables on a report use the same currency. Keep a matched pair per currency and your margins stay accurate.
Who this is for
- Agencies and professional services measuring client billing margins.
- Internal teams that need to know what an initiative really cost in labor.
- Product companies pricing the build cost of a feature or release.
- Fixed-price projects that live or die on staying under budgeted effort.
From “logged” to “billed” with confidence
Cost management is only as trustworthy as the hours underneath it. The strongest setup pairs rate-table economics with two things we cover elsewhere:
- Build the underlying report once and read it five ways: see worklog reports that actually help.
- Make the hours official before you invoice: see how to know when logged time is ready to trust.
Put them together and Jira stops being a place where time disappears, and becomes a place where you can see, per project, per client, per hour, exactly what the work cost and what it earned.
Try it on your own Jira. WorklogPRO is on the Atlassian Marketplace with a free trial. Open Apps → WorklogPRO → Rate Tables to set your rates, then attach them to a report and watch the profit columns appear.
Full setup details are in the WorklogPRO documentation.
This article is part of our Jira time tracking guide: plan, bill, and scale smarter.