Reporting
How to Generate Worklog Reports in Jira That Actually Help
Your team logs time every day. So why is it still so hard to answer a simple question like “Where did last sprint’s effort actually go?” or “How many hours did we spend on this client in May?”
If your honest answer involves exporting a CSV and wrestling it into a spreadsheet, you’re not alone, and you don’t have to keep doing it. Jira is genuinely good at capturing time. It’s just not built to analyze it across the dimensions real teams care about: per person, per project, per epic, per client, billable vs. non-billable.
This guide shows you how to close that gap with WorklogPRO, a timesheets and cost-tracking app for Jira. By the end you’ll be able to build a worklog report that updates itself, slices time any way you need, and exports cleanly to PDF or Excel: no spreadsheet gymnastics.
Why Jira’s native time tracking falls short for reporting
Jira’s built-in time tracking is fine at the issue level. Open an issue, log work, and the Time Tracking field shows estimated vs. logged vs. remaining. That’s the right level of detail for a single ticket.
The trouble starts the moment you need to look across issues:
- Company-managed projects give you a few static reports (Time Tracking, User Workload, Version Workload), but they’re narrow and you can’t freely regroup them.
- Team-managed projects are even thinner, with little more than a worklog pie-chart gadget.
- Neither lets you pivot by client or account, compare billable to non-billable, or roll a month of worklogs up into a timesheet you can hand to finance.
So people fall back on CSV exports and manual spreadsheets, which are out of date the moment someone logs another hour, and which nobody trusts by quarter-end.
The fix isn’t more spreadsheets. It’s a reporting layer that reads your existing Jira worklogs and lets you shape them on demand.
Where worklog reporting lives in WorklogPRO
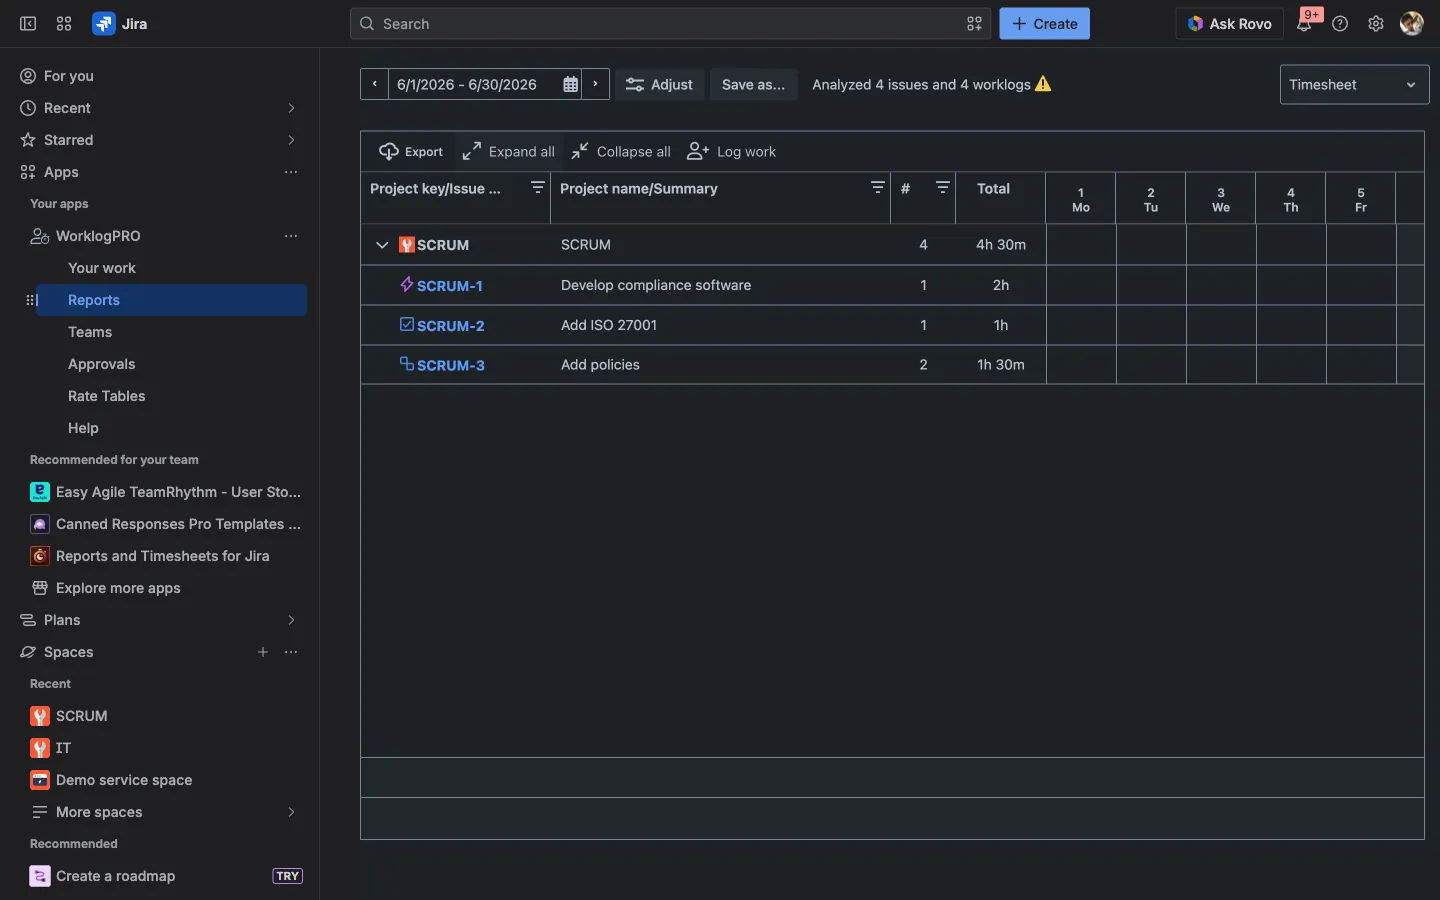
Once WorklogPRO is installed, you reach it from the Jira sidebar: Apps → WorklogPRO. That opens the app’s own navigation: Your work, Reports, Teams, Approvals, Rate Tables, and Help.

The two areas you’ll use most for reporting are:
- Your Work: your personal timesheet, calendar, and charts for time you logged.
- Reports: where you build, save, and reuse reports across people, projects, and teams. This is where the real reporting power lives.
A single WorklogPRO report can be shown through several interchangeable views, switched from the view selector in the top-right corner of the report:
| View | What it’s best for |
|---|---|
| Timesheet | A grid of hours per issue per day, with subtotals: the classic “who logged what” view. |
| Pivot | Cross-tab analysis: drag fields into rows, columns, and values to slice time any way you like. |
| Worklog | A flat list of every individual worklog entry. |
| Chart | Visual breakdowns generated from the timesheet data. |
There’s also a Calendar view (a day/week/month calendar of your worklogs) over on the Your Work page. You build the report once; you read it whichever way answers the question in front of you.
Step 1: Create your report
In the Reports section, open the Create Report dialog. It’s organized into three tabs, and they map neatly onto the three questions every report needs to answer: what, for whom, and at what rate.
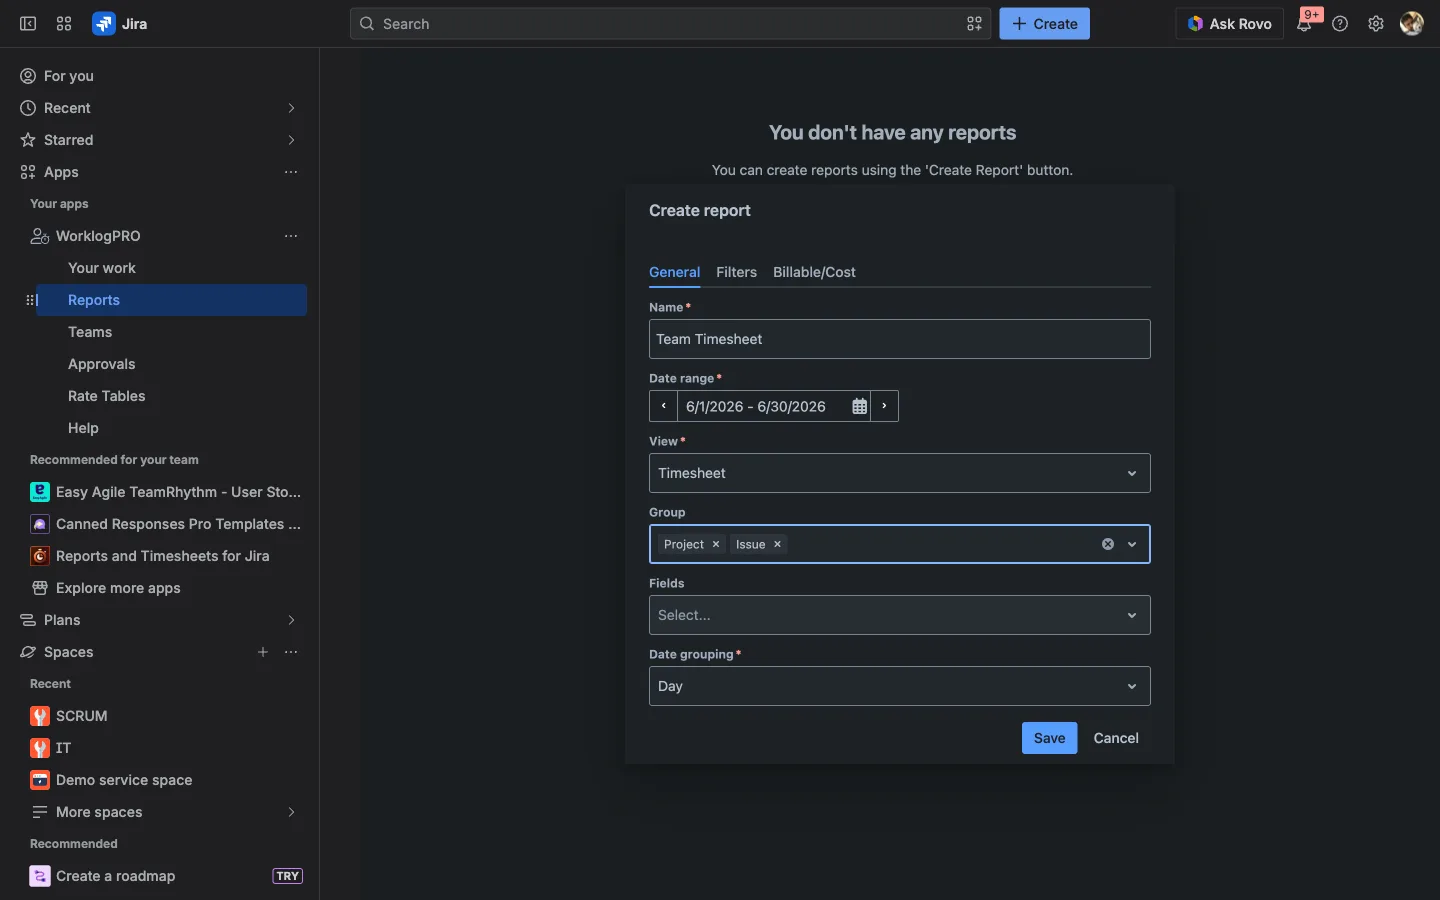
General: name the report, pick a date range (handy presets like this month and last month are built in), choose the view, and set your Group criteria. Grouping is the heart of the report: you can group by Issue, Issue hierarchy, Project, Issue type, Main issue type, User, by Team, or by any Jira field (including custom fields), and you can stack several levels, say Project → Issue.
Filters: scope the data down. Filter by Project, restrict to specific Users or Teams, or drop in a JQL query for anything more precise (e.g. one client’s project plus a label).
Billable/Cost: optional, but this is where reporting turns into money. Attach a Rate table here to bring billable amounts and costs into the report (more on that below).
Save it, and the report becomes a living view. No re-export needed. The next time someone logs an hour against a matching issue, it’s already in the report.
Step 2: Read it as a timesheet
The Timesheet view gives you the familiar grid: rows grouped the way you chose, days across the top, hours in the cells, totals down the side.
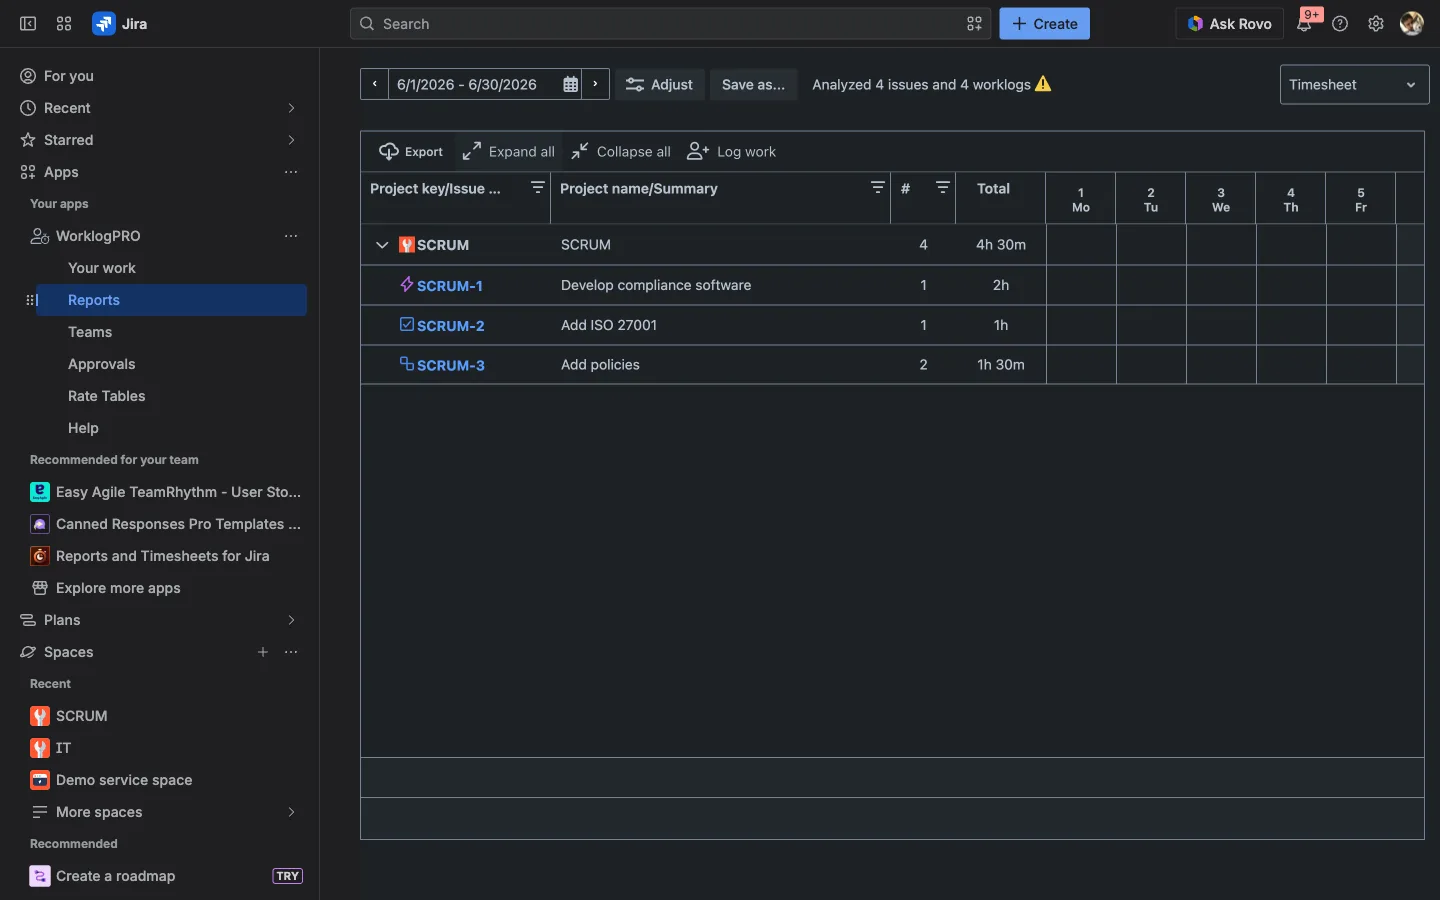
Two things make this more than a static table:
- It’s editable. Click a cell to add, edit, or delete a worklog right there: author, issue, description, and time are all in the cell dialog.
- It’s color-coded. When you’ve configured Work Hour Schemas, the grid turns green when someone hits their daily target and red when logged hours exceed the limit, so under- and over-logging jump out without you doing the math.
Step 3: Pivot for the questions Jira can’t answer
This is the view that replaces your spreadsheet. The Pivot view lets you drag fields into three buckets (Rows, Columns, and Values) and recompute instantly.
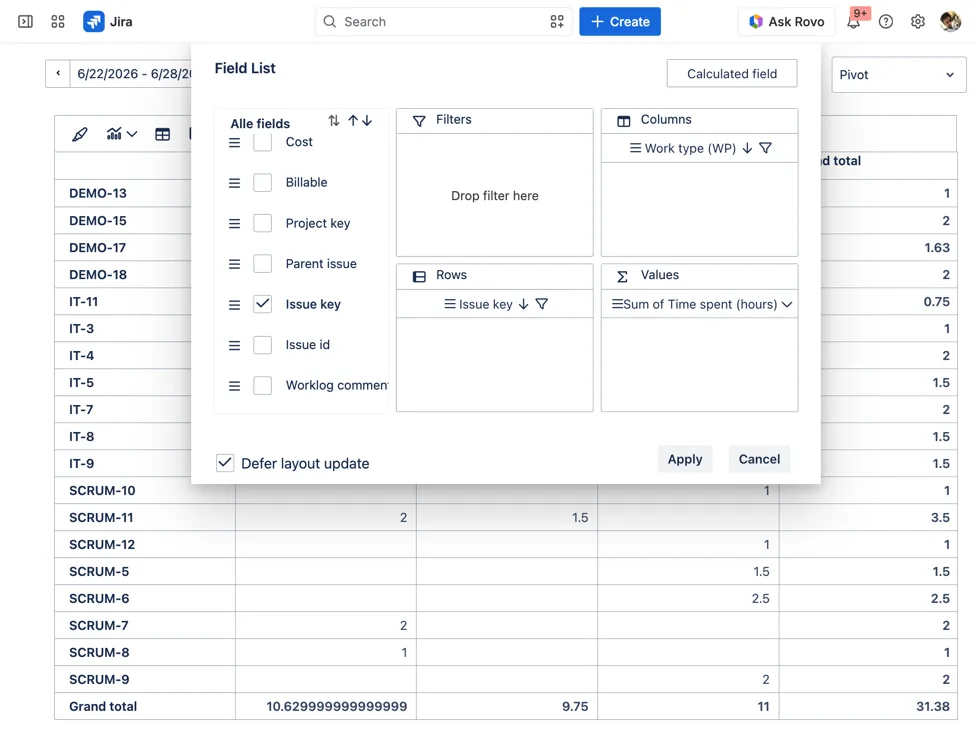
A few pivots that answer common questions:
- Hours per project per month: Rows: Project, Columns: month, Values: time spent.
- Who worked on what: Rows: User, Columns: Project, Values: hours.
- Effort by issue: Rows: Issue, Values: time spent, sorted descending.
The pivot aggregates automatically at every level (sum, average, count) with totals you can trust. You can apply conditional formatting to highlight outliers, show or hide columns, and render the result as a bar, pie, line, column, area, or stacked-bar chart when a picture lands better than a table.
Step 4: Add cost and billable numbers (optional)
If you bill clients or track project budgets, set up Rate Tables once and let every report do the math. (For the full cost story, see Jira cost management with WorklogPRO.)
A rate table is just a name, a currency, and a default rate per hour (with optional rules for overrides). WorklogPRO has two types:
- Billable: what you charge per hour, for invoicing.
- Cost: what an hour actually costs you, for budgets and payroll.
Create a couple of each, say Standard Billable Rates at $120/hr and Internal Cost Rates at $65/hr.
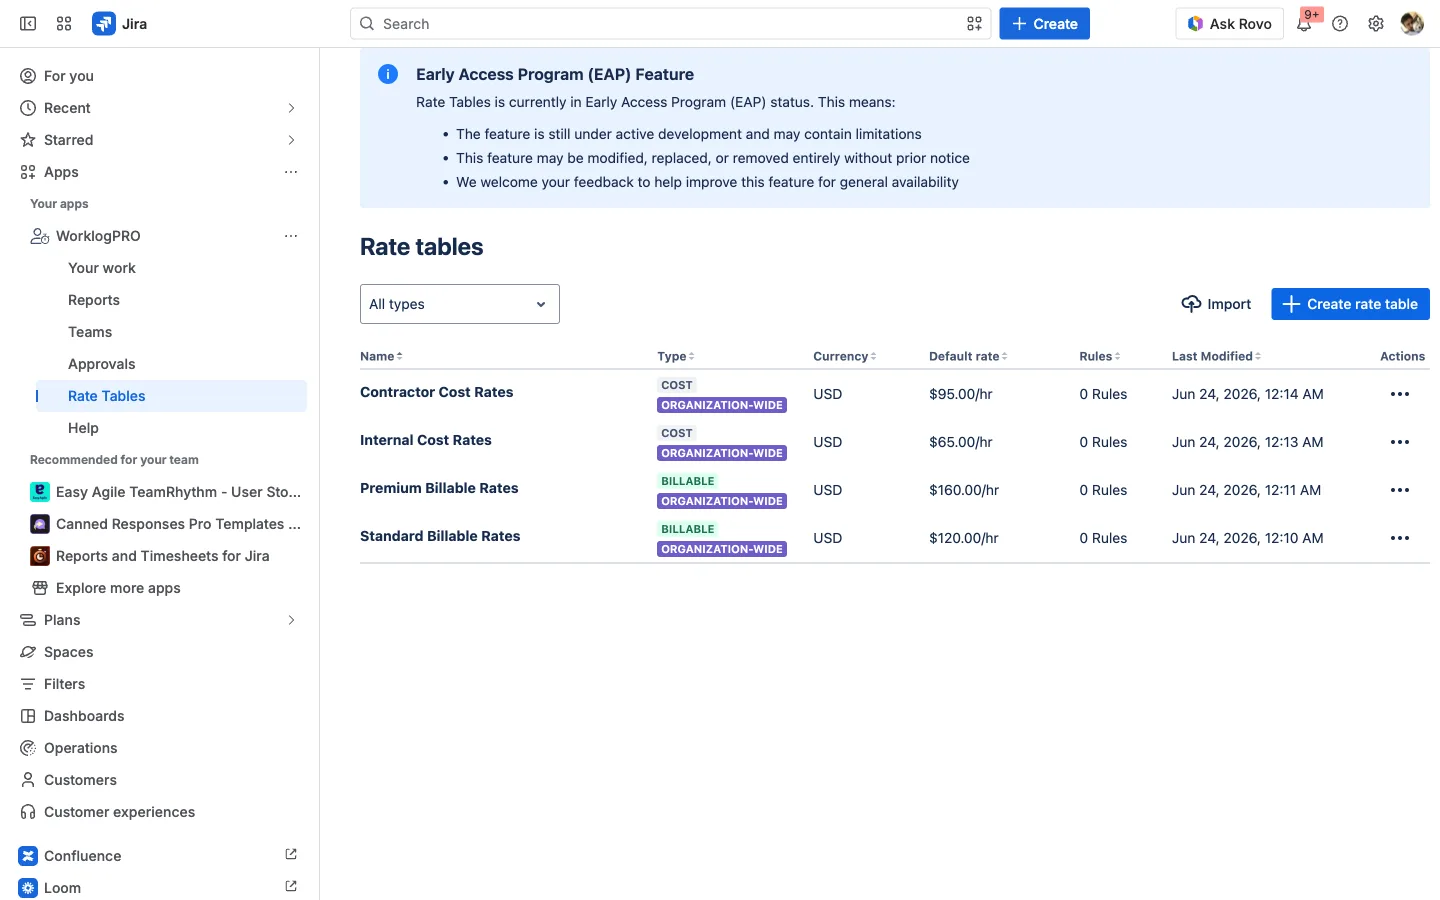
Then open your report’s Billable/Cost tab and point Calculate Billable Using at a billable table and Calculate Cost Using at a cost table (both in the same currency). The report instantly gains money columns (Billable, Cost, Profit, and Profit Margin %) alongside the hours.
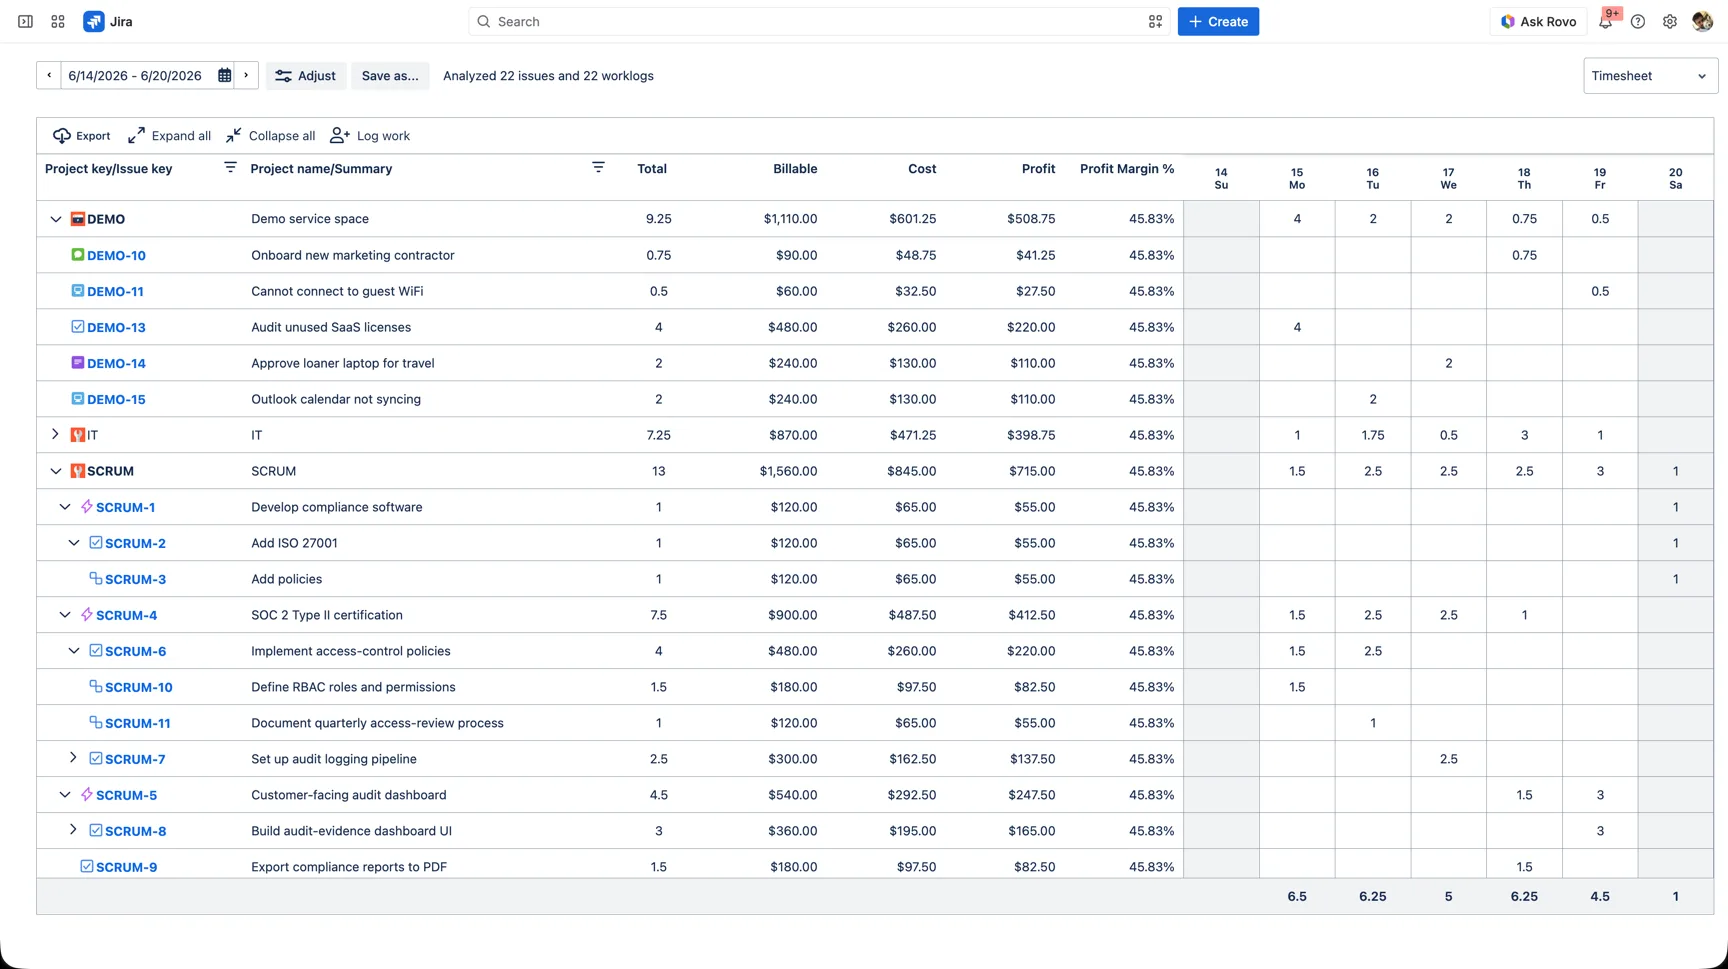
The formulas are exactly what you’d expect: Profit = Billable − Cost, and Margin = Profit ÷ Billable, calculated automatically as long as both tables share a currency. That turns “the team logged 4.5 hours on SCRUM” into “4.5 hours, $540 billable, $292.50 cost, $247.50 profit at a 46% margin”, without a single spreadsheet formula.
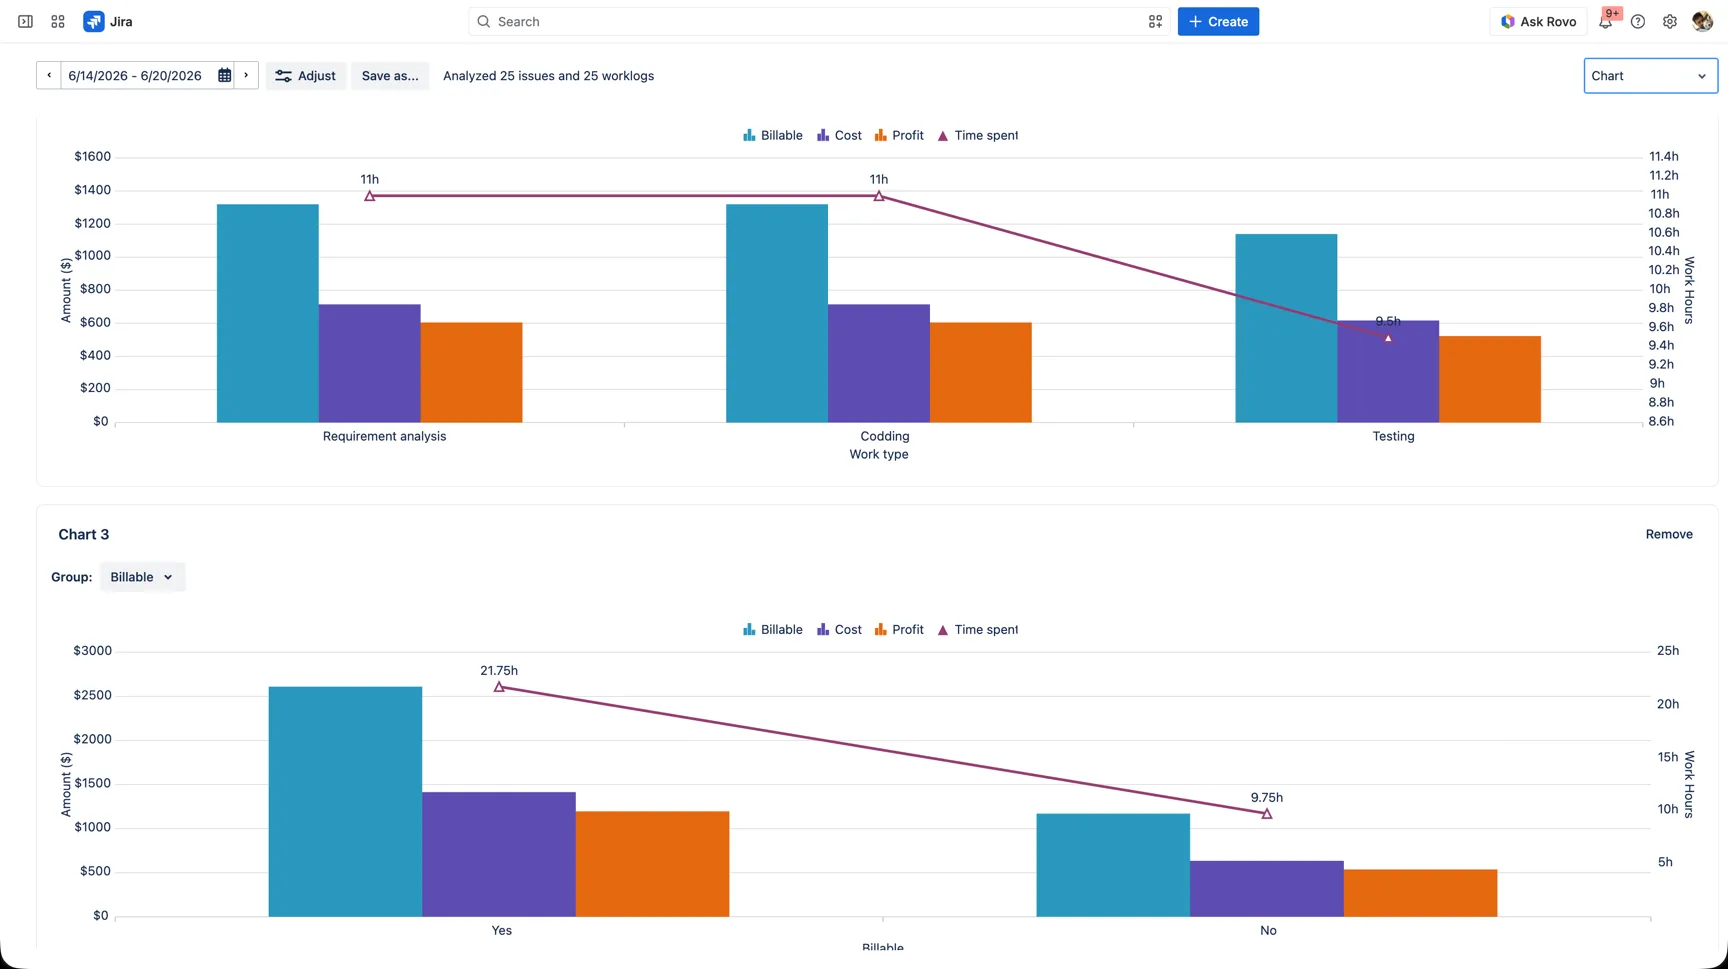
Prefer a picture? Switch the report’s view to Chart and WorklogPRO plots the same numbers visually (Billable, Cost, and Profit as bars with Time spent as a line) grouped however you like, including by your own custom worklog attributes. (WorklogPRO lets you add custom worklog attributes: a Work type dropdown, a Billable flag, an Invoice number, then group and chart by them.) Group by Work type to see where the effort and money go, or by your Billable flag to compare billable against non-billable work at a glance.
Step 5: Export and share
When you need the report out of Jira (for a client, an invoice, or a finance handoff), export it to PDF, Excel, or CSV directly from the report.
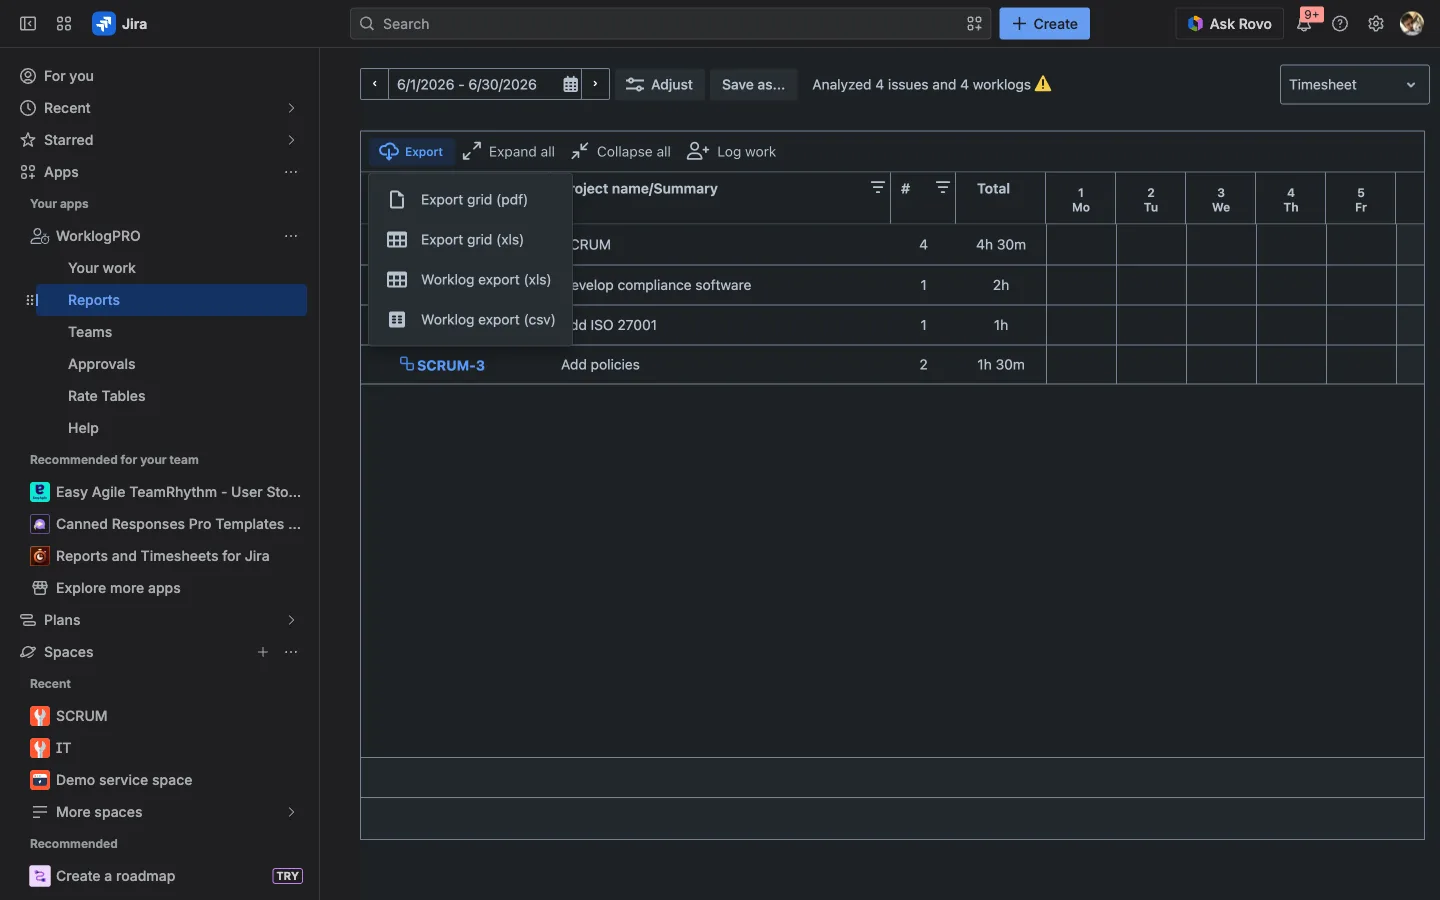
Because the report reads live Jira data, the export always reflects the latest worklogs, not whatever was true the day someone last touched a spreadsheet.
Put it on a dashboard for the whole team
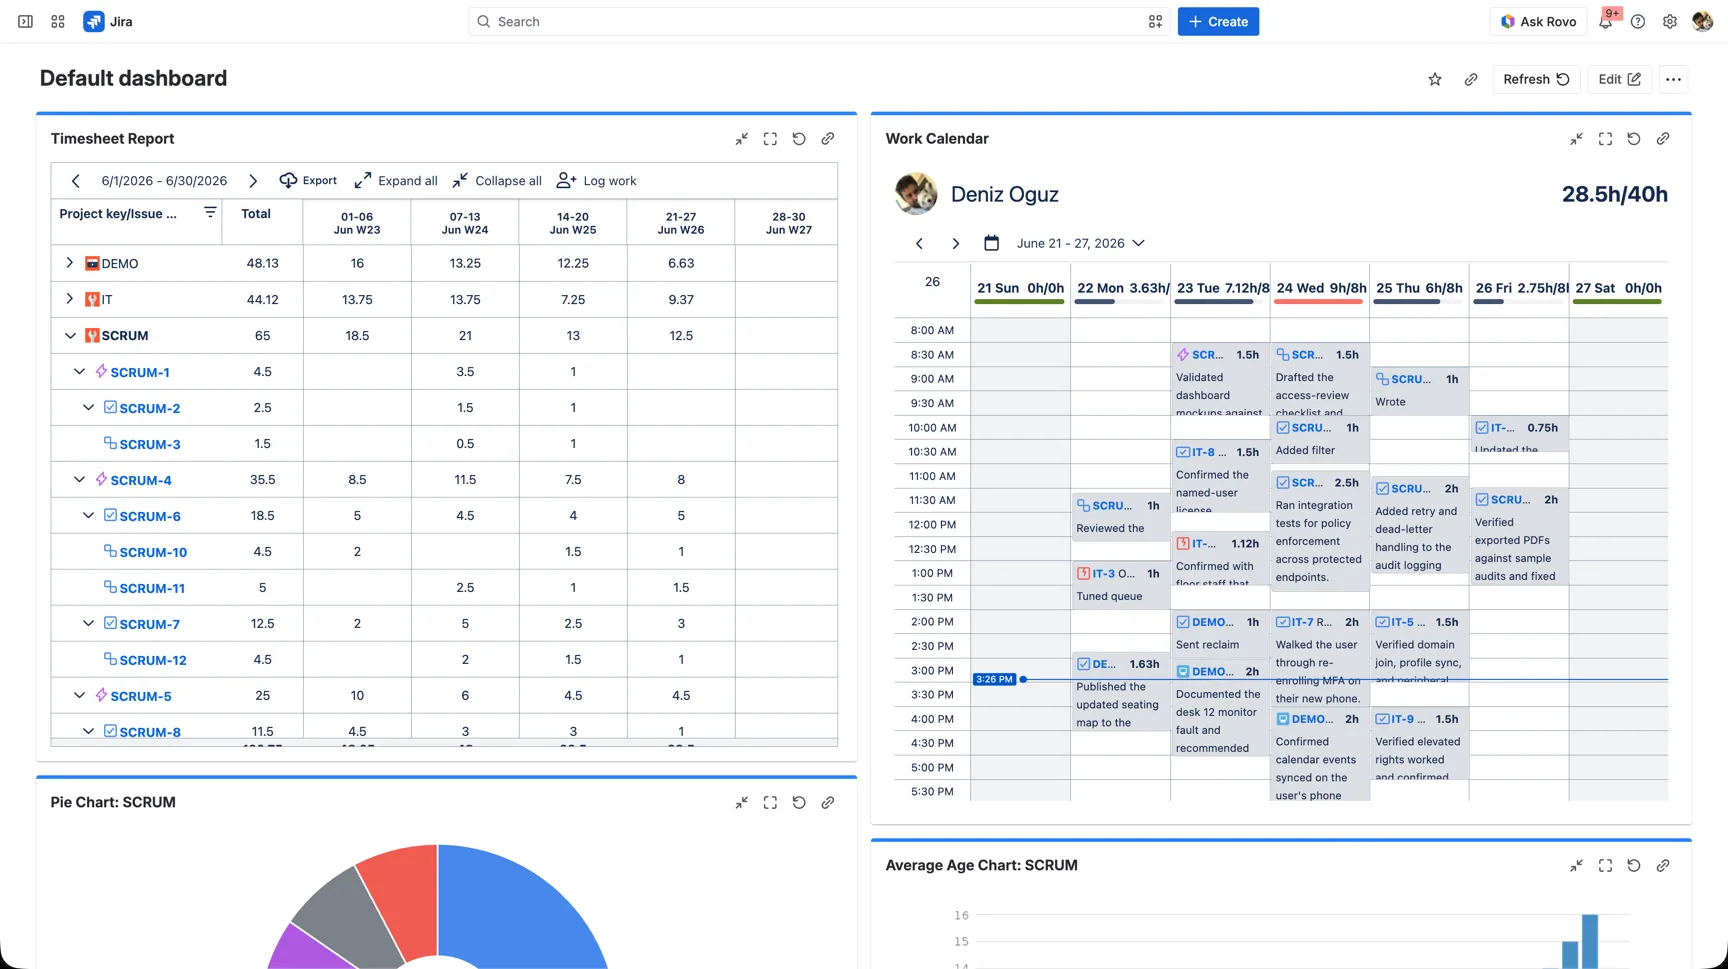
For numbers people should see without opening the app, WorklogPRO ships two Jira dashboard gadgets you add through the normal Add gadget flow:
- Timesheet Report: a timesheet on your dashboard, with the same date-range, grouping, and filtering options as the Reports page. You can even click a cell to log time, and export to PDF or Excel.
- Work Calendar: a calendar gadget for logging and reviewing time by day, week, or month.
Make the numbers official: timesheet approval
A report is only as trustworthy as the worklogs behind it, and the surest way to trust them is to have someone sign off. WorklogPRO’s Timesheet Approvals turns reporting into an accountable workflow: people submit their timesheet for a period, and a manager approves or rejects it.

The approval page is organized by Period, Team, and project, and each row carries a clear status: Open → Submitted → Approved (or Rejected). Managers can Approve or Reject individually, or use Bulk Approve / Bulk Reject to clear a whole period at once. Once a timesheet is approved, the hours behind your reports and cost numbers are no longer just logged: they’re confirmed.
For the full picture of how approval turns raw worklogs into billable, auditable data, see how to know when logged time is ready to trust.
A reporting setup you can actually trust
Here’s the workflow that replaces the CSV-and-spreadsheet ritual:
- Create one report with the grouping and filters that match how your team thinks.
- Read it as a timesheet for the day-to-day “who logged what.”
- Pivot it whenever a new question comes up: client, epic, person, month.
- Attach rate tables if money matters, and let Profit and Margin compute themselves.
- Export or pin it to a dashboard so the numbers stay live and shared.
- Submit it for approval at period close, so the hours are signed off, not just logged.
Logging time was never the hard part. Trusting the report at the end of the month is, and that’s exactly the part WorklogPRO is built for.
Try it on your own Jira. WorklogPRO is available on the Atlassian Marketplace with a free trial. Install it, open Apps → WorklogPRO → Reports, and build the report you’ve been faking in spreadsheets.
Full feature details are in the WorklogPRO documentation.
This article is part of our Jira time tracking guide: plan, bill, and scale smarter.